

It is important to monitor wildlife populations to ascertain how a species is surviving and how that may impact other wildlife populations and forest biodiversity. In many of our state parks, especially in the Hudson Valley, we monitor the deer population and the effect that deer are having on the forest vegetation. One method we use to monitor the deer population is a “distance survey” conducted at night, using spotlights, a range finder (to determine the distance between the deer and the vehicle) and a protractor, for measuring the angle at which the deer were observed. Four people and a vehicle are needed in this survey. Two “spotlighters” sit in the back seat and search for deer, the driver keeps the vehicle at five mph and stops when a deer is seen to get the information on the deer, and a scribe sits in the passenger seat to record the data. Data recorded includes deer group size, sex, age, habitat type, distance in yards and angle from the vehicle. To determine a deer’s sex, the surveyor notes if the deer has antlers or not – age and sex are defined as fawn, doe or buck.
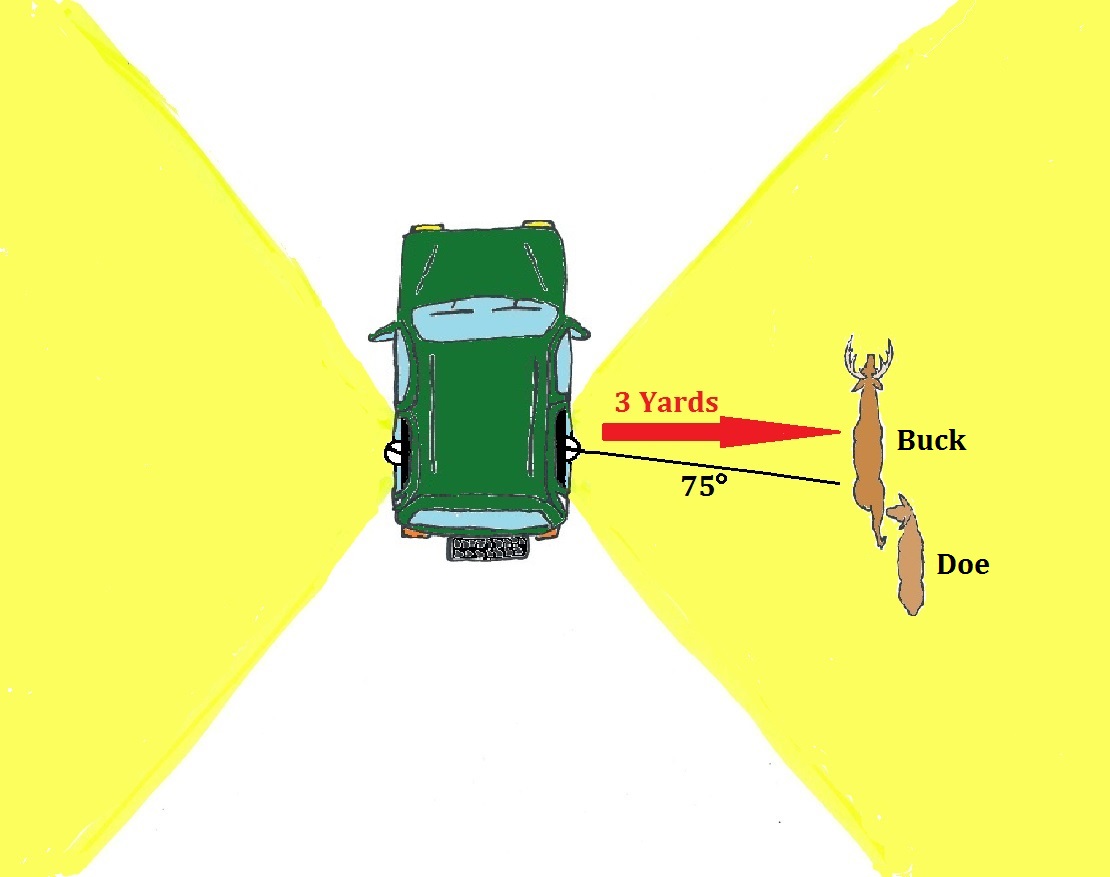
As an example, the above diagram shows a group of two deer at a distance of 3 yards and an angle of 75˚ from the side of the vehicle. The yellow color represents where the surveyors are shining their lights. The surveyor defines this as a group of a buck, due to the antlers, and a doe. These observed deer are in a mowed hayfield, so this habitat type would be recorded as agriculture.


Click on an image above to read the caption.
After driving the predetermined distance sampling routes, we headed home for the evening. Back in the office, the data obtained will be entered into a statistical program that will calculate the number of deer per square mile in this particular park. This data will be compared to previous year’s data to track the deer population and will help determine future wildlife management decisions.
Post, diagram and photos by Lilly Schelling.
